Introduction
Partial discharges are critical indicators of insulation deterioration in high voltage systems. For effective monitoring and diagnosis, graphical visualization of PD activity provides insightful trends and fingerprints.
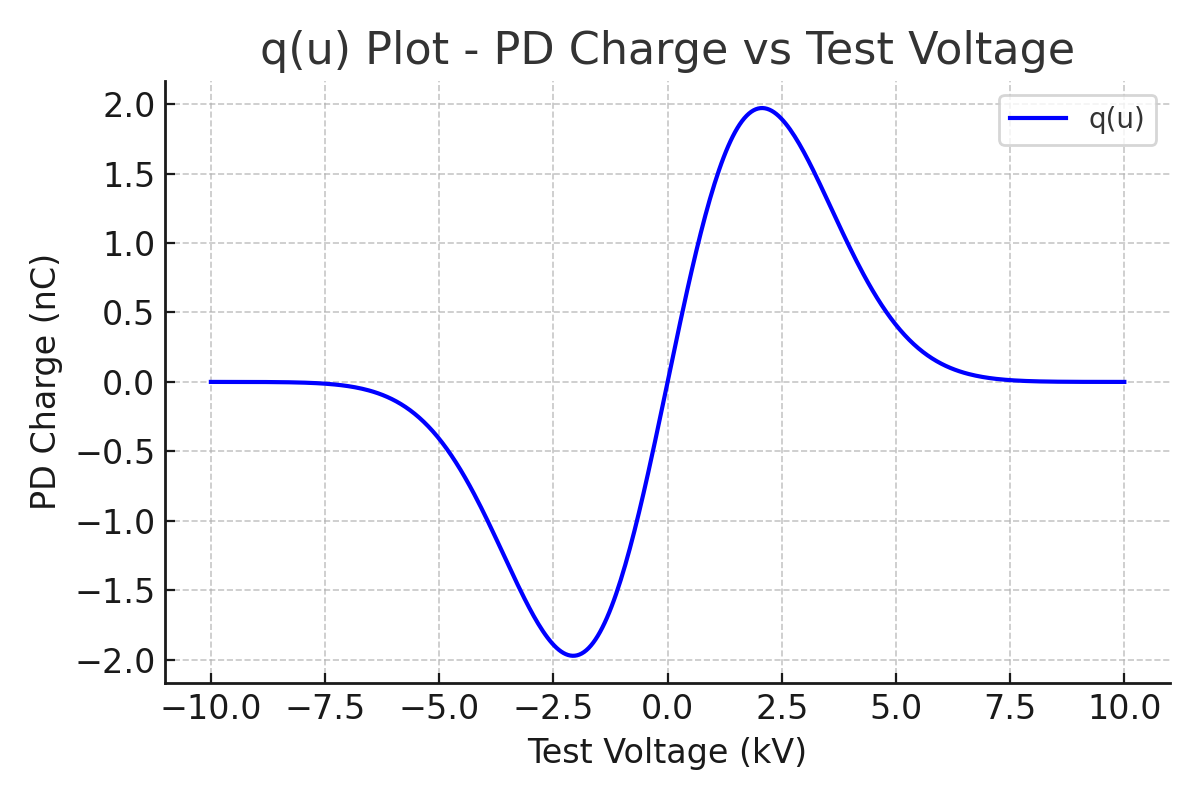
q(u) Plot – PD Charge vs Test Voltage
The q(u) plot displays the measured PD charge as a function of the applied AC test voltage. It helps identify the inception voltage and the discharge activity phase angle within each voltage cycle.
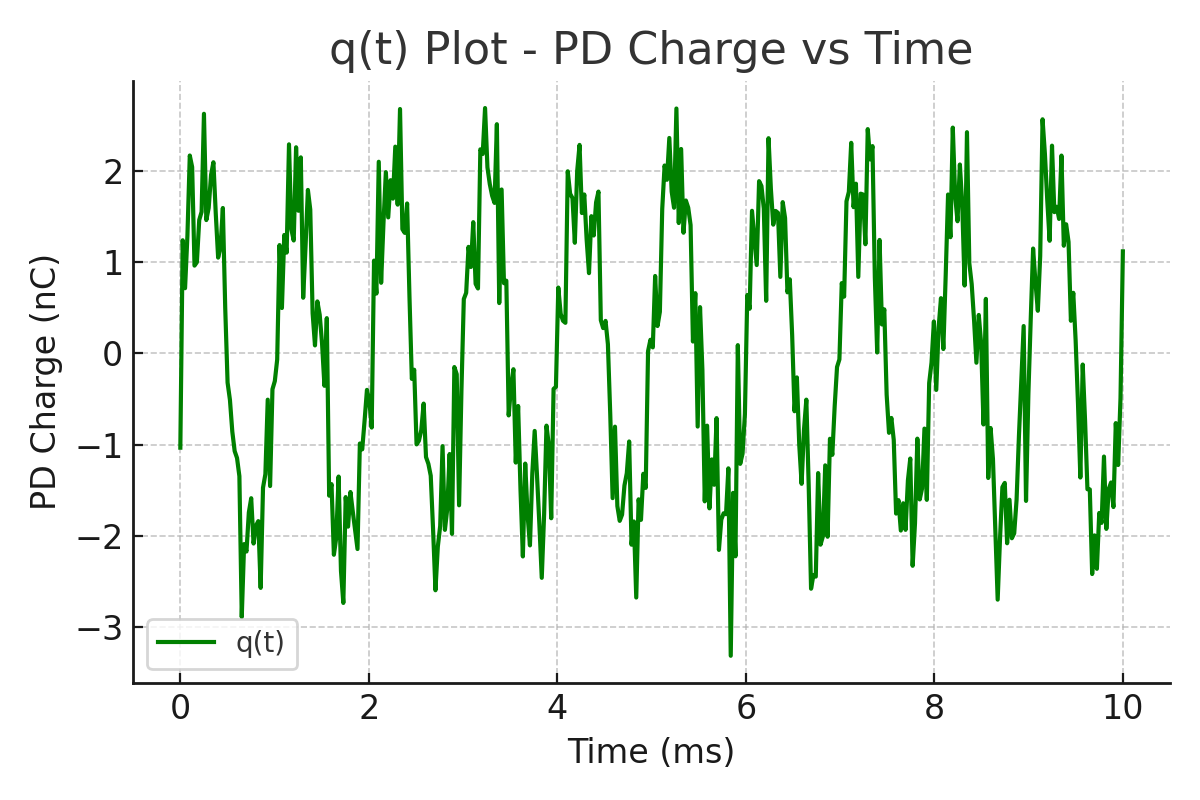
q(t) Plot – PD Charge vs Time
The q(t) plot is used to track PD activity over a period of time. This is especially helpful in detecting intermittent or time-correlated discharges that do not depend solely on voltage amplitude.
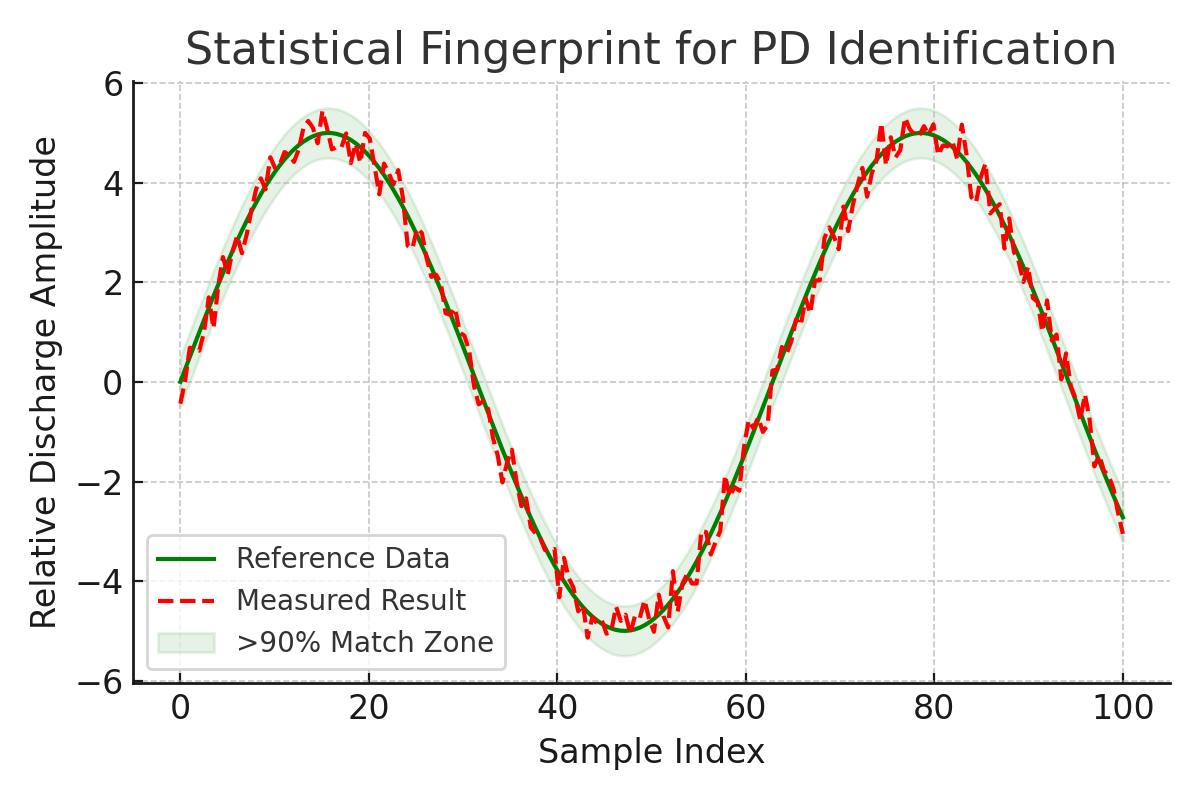
Statistical Fingerprinting
To automate PD source identification, statistical comparison between measured signals and a database of known patterns (reference fingerprints) is used. If the similarity exceeds a threshold (e.g. 90%), the PD source can be confidently categorized.
Separation Techniques – 3CFRD
In cases where multiple PD sources overlap, the 3CFRD (Three-Component Frequency-Resolved Detection) method enables separation based on their distinct spectral signatures. This allows accurate localization and classification of each discharge.
Conclusion
Visualization methods such as q(u), q(t), and statistical fingerprinting significantly enhance the interpretation of PD events. When combined with frequency analysis tools like 3CFRD, engineers can accurately assess the insulation condition and predict potential failures.
